tools.UI_Tables module
Tool for use the multiparamter equation of state of several fluids to high accuracy property calculations.
The module can use several libraries as calculation procedures:
The internal mEoS library
CoolProp
RefProp
The fluids availables depend of library used, for the internal library are:
He (helium)
Ne (neon)
Ar (argon)
Kr (krypton)
Xe (xenon)
H2 (hydrogen)
D2 (deuterium)
pD2 (paradeuterium)
oD2 (orthodeuterium)
pH2 (parahydrogen)
oH2 (ortohydrogen)
N2 (nitrogen)
O2 (oxygen)
F2 (fluorine)
Cl2 (chlorine)
H2O (water)
D2O (heavy water)
CO2 (carbon dioxide)
CO (carbon monoxide)
N2O (nitrous oxide)
SO2 (sulfur dioxide)
COS (carbonyl sulfide)
NH3 (ammonia)
H2S (hydrogen sulfide)
CH4 (methane)
C2 (ethane)
C3 (propane)
nC4 (n-butane)
iC4 (isobutane)
nC5 (pentane)
neoC5 (neopentane)
iC5 (isopentane)
nC6 (hexane)
iC6 (isohexane)
nC7 (heptane)
nC8 (octane)
iC8 (isooctane)
nC9 (nonane)
nC10 (decane)
nC11 (undecane)
nC12 (dodecane)
nC13 (n-Tridecane)
nC14 (n-Tetradecane)
nC15 (n-Pentadecane)
nC16 (n-hexadecane)
nC22 (n-docosane)
C3_pentane (3-Methylpentane)
C22_butane (2,2-dimethylbutane)
C23_butane (2,3-dimethylbutane)
Cyclopropane (cyclopropane)
Cyclopentane (cyclopropane)
Cyclohexane (cyclohexane)
C1Cyclohexane (methylcyclohexane)
C3Cyclohexane (propylcyclohexane)
Benzene (benzene)
Toluene (toluene)
oXylene (o-xylene)
mXylene (m-xylene)
pXylene (p-xylene)
EthylBenzene (ethylbenzene)
Ethylene (ethylene)
Propylene (propylene)
Butene_1 (butene)
Propadiene (Propadiene)
Butadiene13 (1,3-butadiene)
iButene (isobutene)
Cis_2_butene (cis-butene)
Trans_2_butene (trans-butene)
Pentene_1 (1-Pentene)
Hexene_1 (1-hexene)
Acetylene (Acetylene)
Propyne (Propyne)
Butyne_1 (1-butyne)
Cyclobutene (Cyclobutene)
C1Oleate (methyl oleate)
C1Linolenate (methyl linolenate)
C1Linoleate (methyl linoleate)
C1Palmitate (methyl palmitate)
C1Stearate (methyl stearate)
Methanol (Methanol)
Ethanol (ethanol)
nPropanol (1-propanol)
Acetone (acetone)
EthyOxide (ethylene oxide)
PropylenOxide (Propylene oxide)
EthylenGlycol (Ethylene glycol)
PropylenGlycol (Propylene glycol)
AceticAcid (acetic acid)
DME (dimethylether)
DEE (diethyl ether)
THF (tetrahydrofuran)
DEA (Diethanolamine)
MEA (Monoethanolamine)
DMC (dimethyl carbonate)
NF3 (nitrogen trifluoride)
SF6 (sulfur hexafluoride)
HCl (hydrogen chloride)
R13I1 (trifluoroiodomethane)
R11 (trichlorofluoromethane)
R12 (dichlorodifluoromethane)
R13 (chlorotrifluoromethane)
R14 (tetrafluoromethane)
R21 (dichlorofluoromethane)
R22 (chlorodifluoromethane)
R23 (trifluoromethane)
R32 (difluoromethane)
R40 (methyl chloride)
R41 (fluoromethane)
R113 (1,1,2-trichloro-1,2,2-trifluoroethane)
R114 (1,2-dichloro-1,1,2,2-tetrafluoroethane)
R115 (chloropentafluoroethane)
R116 (hexafluoroethane)
R123 (2,2-dichloro-1,1,1-trifluoroethane)
R124 (1-chloro-1,2,2,2-tetrafluoroethane)
R125 (pentafluoroethane)
R134a (1,1,1,2-tetrafluoroethane)
R141b (1,1-dichloro-1-fluoroethane)
R142b (1-chloro-1,1-difluoroethane)
R143a (1,1,1-trifluoroethane)
R150 (1,2-dichloroethane)
R152a (1,1-difluoroethane)
R161 (fluoroethane)
R218 (octafluoropropane)
R227ea (1,1,1,2,3,3,3-heptafluoropropane)
R236ea (1,1,1,2,3,3-hexafluoropropane)
R236fa (1,1,1,3,3,3-hexafluoropropane)
R245ca (1,1,2,2,3-pentafluoropropane)
R245fa (1,1,1,3,3-pentafluoropropane)
R365mfc (1,1,1,3,3-pentafluorobutane)
RC318 (octafluorocyclobutane)
R1123 (Trifluoroethene)
R1130 (Trans-1,2-dichlorothene)
R1224ydZ (cis-1-chloro-2,3,3,3-tetrafluoropropene)
R1234yf (2,3,3,3-tetrafluoropropene)
R1234zeE (trans-1,3,3,3-tetrafluoropropene)
R1234zeZ (cis-1,3,3,3-tetrafluoropropene)
R1243zf (3,3,3-trifluoropropene)
R1216 (hexafluoropropene)
R1233zd (1-chloro-3,3,3-trifluoroprop-1-ene)
R1336mzzE (trans-1,1,1,4,4,4-hexafluorobutene)
R1336mzzZ (cis-1,1,1,4,4,4-hexafluorobutene)
RE1132 (trans-1,2-difluroethene)
RE143a (methyl trifluoromethyl ether)
RE245cb2 (methyl-pentafluoroethyl-ether)
RE245fa2 (2,2,2-trifluoroethyl-difluoromethyl-ether)
RE347mcc (methyl-heptafluoropropyl-ether)
Novec649 (Novec649)
VinylCl (vinyl chloride)
ClBenzene (Chlorobenzene)
C4F10 (perfluorobutane)
C5F12 (perfluoropentane)
C6F14 (perfluorohexane)
D4 (octamethylcyclotetrasiloxane)
D5 (decamethylcyclopentasiloxane)
D6 (dodecamethylcyclohexasiloxane)
MDM (octamethyltrisiloxane)
MD2M (decamethyltetrasiloxane)
MD3M (dodecamethylpentasiloxane)
MD4M (tetradecamethylhexasiloxane)
MM (hexamethyldisiloxane)
Air (air)
R404a (R404A)
R407c (R407C)
R410a (R410A)
R507a (R507A)
LJ (Lennard-Jones Fluid)
All functionality are integrate in pychemqt main program, accesible in main menu Tools/MEoS. Furthermore these equations of state are available to use in process stream properties calculation.
Configuration
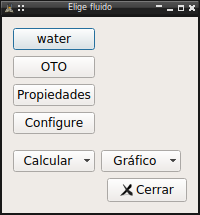
First at all it’s necessary configure the tool, only it’s mandatory to define the fluid to calculate, reference state and propertie shown are configurable too
Fluid
In a open project we must first define the fluid to calculate properties, Tools/MEoS/Fluid. When we have defined a fluid the name appear in this menu option.

In this dialog we can choose the EoS to use, and if there several options, the method to calculate the viscosity or thermal conductivity.
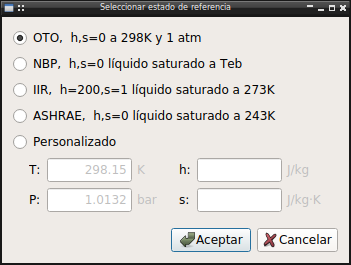
Reference
We can define the reference state for entropy and enthalpy zero point, Tools/MEoS/Reference. We can choose between any of standard reference states or define a custom.
Properties
In table generation the properties to show and the order can be configured here, Tools/MEoS/Properties.
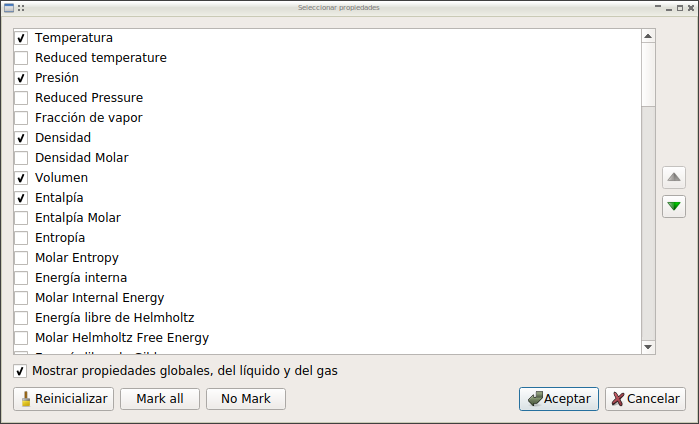
The properties available depend of backend used in library.
Furthermore, for configure the library to use and several parameters for plot generation, use the options Tools/MEoS/Configure, or use the tab in main program Preferences dialog.
Usage
Table
It’s possible use a table to calculate specific properties or to calculate any serie or states, saturation, isoproperties… In all cases it’s possible configure the numeric format, convert values to other unit magnitude or export the data to csv.
Plot
There are direct access to get the usual diagram as T-s, P-h, h-s and more. This plot are generated using the default configuration, but can be edited later by right click over it. The editing option included:
Configure legend in plot
Add/Delete isolines
Add/Delete individual point of isolines
Configure line style and annotation for isolines
Get tabulated data of lines
The resulting plot can be saved to file as png image.
The plot support too mouse click interaction to get properties of selected point.
The procedure of plot data calculation could be very slow, specialy with native library and using high quality definition, for that reason the calculated data are saved in hard-disk to speed-up loading in next execution or other graph generation, that files in .pkl format are saved in main program configuration folder.
API reference
- The module include all UI related functionality of module
- Dialogs for configuration:
reference.Ui_ReferenceState: Dialog to select reference statereference.Ui_Properties: Dialog for select and sort shown properties in tablesprefMEOS.ColorMapCombo: Custom QComboBox to choose a matplotlib colormapprefMEOS.Isolinea: Widget to configure isolines for mEoSprefMEOS.Widget: mEoS parameter configuration dialogprefMEOS.Dialog: Dialog tool for standalone use
- Dialogs for fluid selection:
chooseFluid.Ui_ChooseFluid: Dialog to choose fluid for calculationschooseFluid.DialogFilterFluid: Dialog for filter compounds family to showchooseFluid.Dialog_InfoFluid: Dialog to show parameter of element with meoschooseFluid.Widget_MEoS_Data: Widget to show meos datachooseFluid.transportDialog: Dialog for transport and ancillary equationschooseFluid.Widget_Viscosity_Data: Widget to show viscosity datachooseFluid.Widget_Conductivity_Data: Widget to show thermal conductivity data
- Library function for plugin
library.getMethod(): Return the thermo method name to uselibrary.getClassFluid(): Return the thermo class to calculatelibrary.calcPoint(): Calculate point state and check state in P-T range of eqlibrary.get_propiedades(): Get the properties to show in tableslibrary._getData(): Get values of properties in fluid
- Plot functionality:
plot.PlotMEoS: Plot widget to show meos data as plotplot.Plot2D: Dialog for select a special 2D plotplot.Plot3D: Dialog for define a 3D plotplot.EditPlot: Dialog to edit plotplot.AddLine: Dialog to add new isoline to plotplot.EditAxis: Dialog to configure axes plot propertiesplot.AxisWidget: Dialog to configure axes plot propertiesplot.calcIsoline(): Isoline calculation procedureplot.get_points(): Get point number to plot lines from Preferencesplot.getLineFormat(): get matplotlib line format from preferencesplot.plotIsoline(): plot isoline procedureplot.plot2D3D(): general procedure for plotting 2D and 3Dplot._getunitTransform(): Return the axis unit transform function to map data to configurated unit
- Table functionality:
table.TablaMEoS: Tabla subclass to show meos datatable.Ui_Saturation: Dialog to define a two-phase tabletable.Ui_Isoproperty: Dialog to define a isoproperty tabletable.AddPoint: Dialog to add new point to line2Dtable.createTabla(): create TablaMEoS
The calculation library itself is in the lib.meos module with the compounds implemented in lib.mEoS
- tools.UI_Tables.translate(context: str, sourceText: str, disambiguation: str = None, n: int = -1) str
- class tools.UI_Tables.plugin[source]
Bases:
objectCommon functionality to add to menu and dialog in main window
Methods
LineList(name, Preferences[, fluid])Return a list with the values of isoline name to plot
addTable(fluidos, title)Add table with properties to mainwindow fluidos: List with fluid instances title: Text title for window table
Add blank table to mainwindow to calculata point data
calculatePlot(fluid)Calculate data for plot fluid: class of meos fluid to calculate
Add default properties to configuration automatic when choose fluid or reference state and properties are not defined
Direct access to configuration
plot(x, y[, xscale, yscale, z, mesh, typemesh])Create a plot x: property for axes x y: property for axes y xscale: scale for axis x yscale: scale for axis y z: property for axis z, optional to 3D plot
plot2D()Add a generic 2D plot to project
plot3D()Add a generic 3D plot to project
Show dialog to choose/view fluid
Show dialog to define input for isoproperty table calculations
Show dialog to choose/sort properties to show in tables
Show dialog to choose reference state, use for enthalpy and entropy zero state Don't implemented yet
Show dialog to define input for a two-phase saturation table
- _txt()[source]
Common widget names fTxt: Fluid name, dynamic by configuration refTxt: Reference state name, dynamic by configuration propTxt: Properties option name, fixed confTxt: Configure option name, fixed
QMenu for table actions
QMenu for plot actions
- showReference()[source]
Show dialog to choose reference state, use for enthalpy and entropy zero state Don’t implemented yet
- checkProperties()[source]
Add default properties to configuration automatic when choose fluid or reference state and properties are not defined
- addTable(fluidos, title)[source]
Add table with properties to mainwindow fluidos: List with fluid instances title: Text title for window table
- class tools.UI_Tables.Menu(parent=None)[source]
Bases:
QMenu,pluginQMenu to import in mainwindow with all meos addon functionality
Methods
Populate menu, check if fluid and reference state are defined to enable/disable calculation/plot option
Populate menu, check if fluid and reference state are defined to enable/disable calculation/plot option
- class tools.UI_Tables.Dialog(config=None, parent=None)[source]
Bases:
QDialog,pluginDialog to choose fluid for meos plugins calculations
- tools.UI_Tables.chooseFluid.translate(context: str, sourceText: str, disambiguation: str = None, n: int = -1) str
- class tools.UI_Tables.chooseFluid.Ui_ChooseFluid(config=None, parent=None)[source]
Bases:
QDialogDialog to choose fluid for meos plugins calculations
- Attributes:
- group
Methods
fill(compounds)Fill list fluid compounds: List of MEoS subclasses to show
filter()Show dialog with group compound filter
id()Return correct id of selected fluid in mEoS.__all__ list
info()Show info dialog for fluid
update(indice)Update data when selected fluid change
- all = True
- group = None
- class tools.UI_Tables.chooseFluid.DialogFilterFluid(showAll=True, group=None, parent=None)[source]
Bases:
QDialogDialog for filter compounds family to show
- text = {'Alkanes': 'Alkanes', 'Alkenes': 'Alkenes', 'CFCs': 'CFCs', 'Gases': 'Gases', 'Heteroatom': 'Heteroatom', 'Naphthenes': 'Naphthenes', 'Nobles': 'Noble gases', 'PseudoCompounds': 'Pseudo Compounds', 'Siloxanes': 'Siloxanes'}
- classOrder = ['Nobles', 'Gases', 'Alkanes', 'Naphthenes', 'Alkenes', 'Heteroatom', 'CFCs', 'Siloxanes', 'PseudoCompounds']
- class tools.UI_Tables.chooseFluid.Dialog_InfoFluid(element, parent=None)[source]
Bases:
QDialogDialog to show parameter of element with meos
Methods
fill(element)Fill values
more()Show parameter for transport and ancillary equations
- class tools.UI_Tables.chooseFluid.Widget_MEoS_Data(eq, parent=None)[source]
Bases:
QWidgetWidget to show meos data
Methods
fill(eq)Fill widget with data of equations
- class tools.UI_Tables.chooseFluid.transportDialog(element, parent=None)[source]
Bases:
QDialogDialog to show parameters for transport and ancillary equations
- class tools.UI_Tables.chooseFluid.Widget_Viscosity_Data(element, eq, parent=None)[source]
Bases:
QWidgetWidget to show viscosity data
- class tools.UI_Tables.chooseFluid.Widget_Conductivity_Data(element, eq, parent=None)[source]
Bases:
QWidgetWidget to show thermal conductivity data
- tools.UI_Tables.library.getClassFluid(method, fluid)[source]
Return the thermo class to calculate Really return the base instance to add kwargs to calculate
- tools.UI_Tables.library.calcPoint(fluid, conf, **kwargs)[source]
Procedure to calculate point state and check state in P-T range of eq
- tools.UI_Tables.library.get_propiedades(conf)[source]
Procedure to get the properties to show in tables Input:
conf: configparser instance with mainwindow preferences
- eanOutput:
array with properties, key and units
- tools.UI_Tables.library._getData(fluid, keys, phase=True, unit=None)[source]
Procedure to get values of properties in fluid Input:
fluid: fluid instance to get values keys: array with desired parameter to get phase: boolean to get the properties values for both phases unit: unidades subclass
- tools.UI_Tables.library.saveProperties(fluids)[source]
Save all available properties of a list of fluids
- tools.UI_Tables.plot.translate(context: str, sourceText: str, disambiguation: str = None, n: int = -1) str
- class tools.UI_Tables.plot.PlotMEoS(dim, toolbar=False, filename='', parent=None)[source]
Bases:
QWidgetPlot widget to show meos plot data, add context menu options
Methods
click(event)Update input and graph annotate when mouse click over chart
closeEvent(event)Force save status of window at exit
contextMenuEvent(event)Create context menu
edit()Show edit plot dialog
editAxis()Show edit axes dialog
grid(boolean)Set grid visibility of plot
mouseMoveEvent(event)Mouse move event over the plot
readFromJSON(data, parent)Read window data from file
Show dialog with properties of selected fluid
table(obj)Export plot data to table Input: obj: object (Line2D instance) to show data
writeToJSON(data)Write instance parameter to file
changeStatusThermo
clearPointData
mouseMove
showPointData
updatePosition
- icon = '/home/docs/checkouts/readthedocs.org/user_builds/pychemqt/checkouts/latest/images/button/plot.png'
- mouseMove
pyqtSignal(*types, name: str = …, revision: int = …, arguments: Sequence = …) -> PYQT_SIGNAL
types is normally a sequence of individual types. Each type is either a type object or a string that is the name of a C++ type. Alternatively each type could itself be a sequence of types each describing a different overloaded signal. name is the optional C++ name of the signal. If it is not specified then the name of the class attribute that is bound to the signal is used. revision is the optional revision of the signal that is exported to QML. If it is not specified then 0 is used. arguments is the optional sequence of the names of the signal’s arguments.
- class tools.UI_Tables.plot.Plot2D(parent=None)[source]
Bases:
QDialogDialog for select a special 2D plot
Methods
ejeXChanged(index)Fill variables available in ejeY, all except the active in ejeX
- class tools.UI_Tables.plot.Plot3D(parent=None)[source]
Bases:
QDialogDialog for configure a 3D plot
Methods
ejeXChanged(index)Fill variables available in ejeY, all except the active in ejeX
ejeYChanged(indY)Fill variables available in ejeZ, all except the actives in other
- class tools.UI_Tables.plot.EditPlot(plotMEoS, parent=None)[source]
Bases:
QDialogDialog to edit plot. This dialog let user change plot properties
Methods
add()Add a isoline to plot
changeValue(key, value)Update plot data
remove()Remove a line from plot
update(i)Fill format widget with value of selected line
- class tools.UI_Tables.plot.AddLine(parent=None)[source]
Bases:
QDialogDialog to add new isoline to plot
Methods
isolineaChanged(key)Let show only the active inputs
- lineas = [('Isotherm', <class 'lib.unidades.Temperature'>, None), ('Isobar', <class 'lib.unidades.Pressure'>, None), ('Isoenthalpic', <class 'lib.unidades.Enthalpy'>, None), ('Isoentropic', <class 'lib.unidades.SpecificHeat'>, 'SpecificEntropy'), ('Isochor', <class 'lib.unidades.SpecificVolume'>, None), ('Isodensity', <class 'lib.unidades.Density'>, None), ('Isoquality', <class 'float'>, None)]
- class tools.UI_Tables.plot.EditAxis(fig=None, parent=None)[source]
Bases:
QDialogDialog to configure axes plot properties, label, margins, scales
Methods
populate()Fill widget with plot parameters
update(key, value)Update plot Input: key: plot parameter key to update value: new value for key
- tools.UI_Tables.plot.convertFont(qfont)[source]
Convert qt QFont class properties to FontProperties to use in matplotlib
- Parameters:
- qfontQFont
QFont with properties to extract
- Returns:
- fontFontProperties
FontProperties instance to use in any matplotlib text instance
- class tools.UI_Tables.plot.AxisWidget(name, parent=None)[source]
Bases:
QGroupBoxDialog to configure axes plot properties
- tools.UI_Tables.plot.calcIsoline(f, conf, var, fix, vvar, vfix, ini, step, end, total, bar)[source]
Procedure to calculate isoline. In isotherm and isobar add to calculate point the saturated states in two-phases region
- tools.UI_Tables.plot.get_points(Preferences)[source]
Get point number to plot lines from Preferences
- tools.UI_Tables.plot.getLineFormat(Preferences, name)[source]
get matplotlib line format from preferences Preferences: configparser instance with pycheqmt preferences name: name of isoline
- tools.UI_Tables.plot.plotIsoline(data, axis, title, unidad, grafico, transform, **fmt)[source]
Procedure to plot any isoline Input:
data: section of property isoline of matrix data axis: array with keys of three axis, z None in 2D plot title: key of isoline type unidad: unidades subclass with isoline unit grafico: PlotMEoS instance to plot data transform: unit transform function for use configurated units in plots fmt: any matplotlib plot kwargs
- tools.UI_Tables.plot.plot2D3D(grafico, data, Preferences, x, y, z=None, mesh=False, typemesh=0)[source]
Plot procedure Parameters:
grafico: plot data: data to plot Preferences: ConfigParser instance from mainwindow preferencesChanged x: Key for x axis y: Key for y axis z: Key for z axis Optional for 3D plot
- tools.UI_Tables.plot._getunitTransform(eje)[source]
Return the axis unit transform function to map data to configurated unit Parameters:
eje: list with axis property keys
- class tools.UI_Tables.reference.Ui_ReferenceState(config=None, parent=None)[source]
Bases:
QDialogDialog for select reference state
Methods
setEnabled(boolean)Enable custom entriees
- class tools.UI_Tables.reference.Ui_Properties(config=None, parent=None)[source]
Bases:
QDialogDialog for select and sort shown properties in tables
Methods
Down()Change current selected row with next row
Up()Change current selected row with previous row
buttonClicked(boton)Actions for dialogbuttonbox functionality
comprobarBotones(fila)Check if button are enabled or disabled
Properties list
toggleCheck(fila, columna)Toggle check status with a doubleclick in row
- _default = [1, 0, 1, 0, 0, 1, 0, 1, 1, 0, 0, 0, 0, 0, 0, 0, 0, 0, 0, 0, 0, 0, 0, 0, 0, 0, 0, 0, 0, 0, 0, 0, 0, 0, 0, 0, 0, 0, 0, 0, 0, 0, 0, 0, 0, 0, 0, 0, 0, 0, 0, 0, 0, 0, 0, 0, 0, 0, 0, 0, 0, 0, 0, 0, 0, 0, 0, 0, 0, 0, 0, 0, 0, 0, 0]
- tools.UI_Tables.table.translate(context: str, sourceText: str, disambiguation: str = None, n: int = -1) str
- tools.UI_Tables.table.createTabla(conf, title, fluidos=None, parent=None)[source]
Create TablaMEoS to add to mainwindow
- Parameters:
- confConfigParser
configparser instance with project configuration
- titlestr
title for the table
- fluidoslib.MEoS
optional array with meos instances to fill de table
- parentobject
mainwindow pointer
- class tools.UI_Tables.table.TablaMEoS(*args, **kwargs)[source]
Bases:
TablaTabla customize to show meos data, add context menu options, save and load support in project
- Attributes:
- Plot
- Point
Methods
add(row)Add point to a table and to saved file
calculatePoint(row, column)Add new value to kwargs for point, and show properties if it is calculable row, column: index for modified cell in table
changeStatusThermo(conf)Change text show in status of mainwindow
closeEvent(event)Force project changes to save at exit
contextMenuEvent(event)Show context menu over cell
copy([event])Copy selected values to clipboard
delete(rows)Delete rows from table and for saved data
Export data table as a csv file
hHeaderClicked(event)Show dialog to config format and unit
readFromJSON(data, parent)Load data table from saved file
Show selected point in table in asociated plot if exist
setData(data)Override Tabla method to adapt functionality
setRow(row, data)Add data to a row
setStr()Add data as string to cell table
Show fluid info dialog
vHeaderClicked(position)Show dialog to manage item in table
writeToJSON(data)Write instance parameter to file
- Plot = None
- icon = '/home/docs/checkouts/readthedocs.org/user_builds/pychemqt/checkouts/latest/images/button/table.png'
- Point = None
- __init__(*args, **kwargs)[source]
Constructor with additional kwargs don’t recognize in Tabla keys: array with keys properties units: array of unidades subclasses orderUnit: array of index of unit magnitud to show format: array of dict with numeric format
- class tools.UI_Tables.table.Ui_Saturation(method=None, fluid=None, parent=None)[source]
Bases:
QDialogDialog to define input for a two-phase saturation table calculation
Methods
updateVar(boolean)Update input values units and text
Update state for option to choose for properties to change
- class tools.UI_Tables.table.Ui_Isoproperty(parent=None)[source]
Bases:
QDialogDialog to define input for isoproperty table calculations
Methods
actualizarUI(indice)Update UI
actualizarVariable(indice)Update UI variables
- propiedades = ['Temperature', 'Pressure', 'Density', 'Volume', 'Enthalpy', 'Entropy', 'Internal Energy']
- unidades = [<class 'lib.unidades.Temperature'>, <class 'lib.unidades.Pressure'>, <class 'lib.unidades.Density'>, <class 'lib.unidades.SpecificVolume'>, <class 'lib.unidades.Enthalpy'>, <class 'lib.unidades.SpecificHeat'>, <class 'lib.unidades.Enthalpy'>, <class 'float'>]
- keys = ['T', 'P', 'rho', 'v', 'h', 's', 'u', 'x']
- class tools.UI_Tables.table.AddPoint(fluid, melting=False, parent=None)[source]
Bases:
QDialogDialog to add new point to line2D
Methods
click(button)Manage mouse click event over buttonbox
fill(fluid)Fill dialog widget with fluid properties values
reset()Reset dialog widgets to initial clear status
update(key, value)Update fluid instance with new parameter key with value
- keys = ['T', 'P', 'x', 'rho', 'v', 'h', 's', 'u']
