lib.mEoS.Ethylene
Fluid info
CAS Number: 74-85-1
Formula: CH2=CH2
Synonym: R-1150
Molecular weigth: 28.05316 g/mol
Tc: 282.3500 K
Pc: 5.0418 MPa
ρc: 214.2400 kg/m³
Tt: 103.9890 K
Tb: 169.3790 K
Acentric factor: 0.0866
Dipole moment: 0.0 Debye
Equation of state
Smukala, J., Span, R., Wagner, W.; New equation of state for ethylene covering the fluid region from the melting line to 450 K at pressures up to 300 MPa. J. Phys. Chem. Ref. Data 29(5) (2000) 1053-1121, http://dx.doi.org/10.1063/1.1329318
McCarty, R.D., Jacobsen, R.T.; An Equation of State for Fluid Ethylene. Natl. Bur. Stand., Tech. Note 1045, 1981.
Jahangiri, M., Jacobsen, R.T, Stewart, R.B., McCarty, R.D.; Thermodynamic properties of ethylene from the freezing line to 450 K at pressures to 260 MPa. J. Phys. Chem. Ref. Data 15(2) (1986) 293-734, http://dx.doi.org/10.1063/1.555753
Span, R., Wagner, W.; Equations of state for technical applications. II. Results for nonpolar fluids.. Int. J. Thermophys. 24 (1) (2003) 41-109, http://dx.doi.org/10.1023/A:1022310214958
Sun, L., Ely, J.F.; Universal equation of state for engineering application: Algorithm and application to non-polar and polar fluids. Fluid Phase Equilib., 222-223 (2004) 107-118, http://dx.doi.org/10.1016/j.fluid.2004.06.028
Viscosity
Sotiriadou, S., Ntonti, E., Assael, M.J., Perkins, R.A., Huber, M.L.,; Reference Correlations of the Viscosity of Ethene from the Triple Point to 450 K and up to 195 MPa. Int. J. Thermophysics 45 (2024) 87, http://dx.doi.org/10.1007/s10765-024-03378-4
Holland, P.M., Eaton, B.E., Hanley, H.J.M.; A Correlation of the Viscosity and Thermal Conductivity Data of Gaseous and Liquid Ethylene. J. Phys. Chem. Ref. Data 12(4) (1983) 917-932, http://dx.doi.org/10.1063/1.555701
Thermal Conductivity
Assael, M.J., Koutian, A., Huber, M.L., Perkins, R.A.; Reference Correlations of the Thermal Conductivity of Ethene and Propene. J. Phys. Chem. Ref. Data 45(3) (2016) 033104, http://dx.doi.org/10.1063/1.4958984
Holland, P.M., Eaton, B.E., Hanley, H.J.M.; A Correlation of the Viscosity and Thermal Conductivity Data of Gaseous and Liquid Ethylene. J. Phys. Chem. Ref. Data 12(4) (1983) 917-932, http://dx.doi.org/10.1063/1.555701
Calculation example
Using the first option for equation of state, we can get this diagram plots with the liquid-gas saturation region:
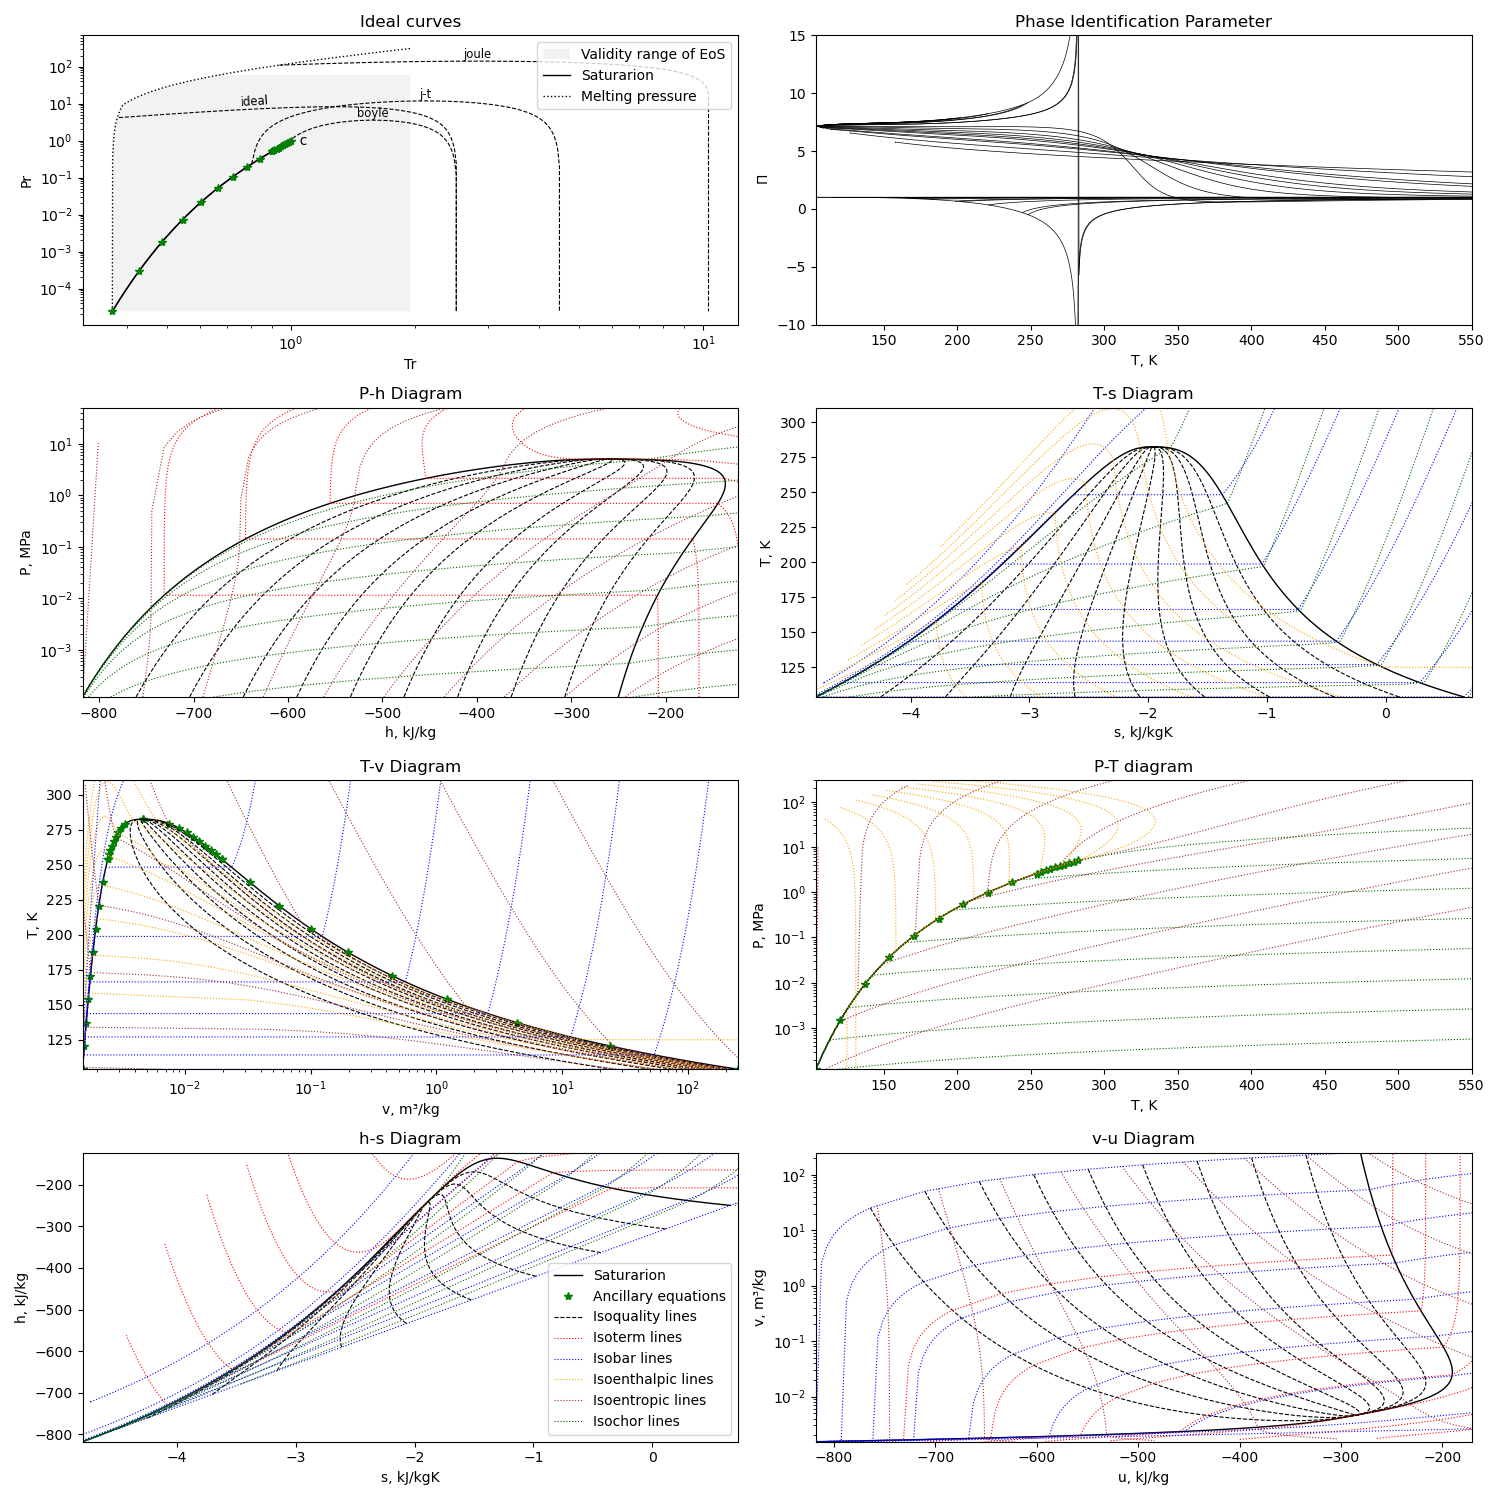
The diagram is generated with this module running with the compound name as parameter or edited in file
python3 plotMEoS.py Ethylene
