lib.mEoS.nC6
Fluid info
CAS Number: 110-54-3
Formula: CH3-(CH2)4-CH3
Molecular weigth: 86.17536 g/mol
Tc: 507.8200 K
Pc: 3.0340 MPa
ρc: 233.1819 kg/m³
Tt: 177.8300 K
Tb: 341.8600 K
Acentric factor: 0.299
Dipole moment: 0.0700 Debye
Equation of state
Span, R., Wagner, W.; Equations of state for technical applications. II. Results for nonpolar fluids.. Int. J. Thermophys. 24 (1) (2003) 41-109, http://dx.doi.org/10.1023/A:1022310214958
Huber, M.L., Lemmon, E.W., Bell, I.H., McLinden, M.O.; The NIST REFPROP Database for Highly Accurate Properties of Industrially Importants Fluids. Ind. Eng. Chem. Res. 61(42) (2022) 15449-15472, http://dx.doi.org/10.1021/acs.iecr.2c01427
Kunz, O., Wagner, W.; The GERG-2008 Wide-Range Equation of State for Natural Gases and Other Mixtures: An Expansion of GERG-2004. J. Chem.Eng. Data 57(11) (2012) 3032-3091, http://dx.doi.org/10.1021/je300655b
Polt, A., Platzer, B., Maurer, G.; Parameter der thermischen Zustandsgleichung von Bender fuer 14 mehratomige reine Stoffe. Chem. Technik 22(1992)6 , 216/224
Starling, K.E.; Fluid Thermodynamic Properties for Light Petroleum Systems. Gulf Publishing Company, 1973.
Sun, L., Ely, J.F.; Universal equation of state for engineering application: Algorithm and application to non-polar and polar fluids. Fluid Phase Equilib., 222-223 (2004) 107-118, http://dx.doi.org/10.1016/j.fluid.2004.06.028
Viscosity
Michailidou, E.K., Assael, M.J., Huber, M.L., Perkins, R.A.; Reference Correlation of the Viscosity of n-Hexane from the Triple Point to 600 K and up to 100 MPa. J. Phys. Chem. Ref. Data 42(3) (2013) 033104, http://dx.doi.org/10.1063/1.4818980
Quiñones-Cisneros, S.E., Deiters, U.K.; Generalization of the Friction Theory for Viscosity Modeling. J. Phys. Chem. B, 110(25) (2006) 12820-12834, http://dx.doi.org/10.1021/jp0618577
Thermal Conductivity
Assael, M.J., Mylona, S.K., Tsiglifisi, Ch.A., Huber, M.L., Perkins, R.A.; Reference Correlation of the Thermal Conductivity of n-Hexane from the Triple Point to 600 K and up to 500 MPa. J. Phys. Chem. Ref. Data 42(1) (2013) 013106, http://dx.doi.org/10.1063/1.4793335
Calculation example
Using the first option for equation of state, we can get this diagram plots with the liquid-gas saturation region:
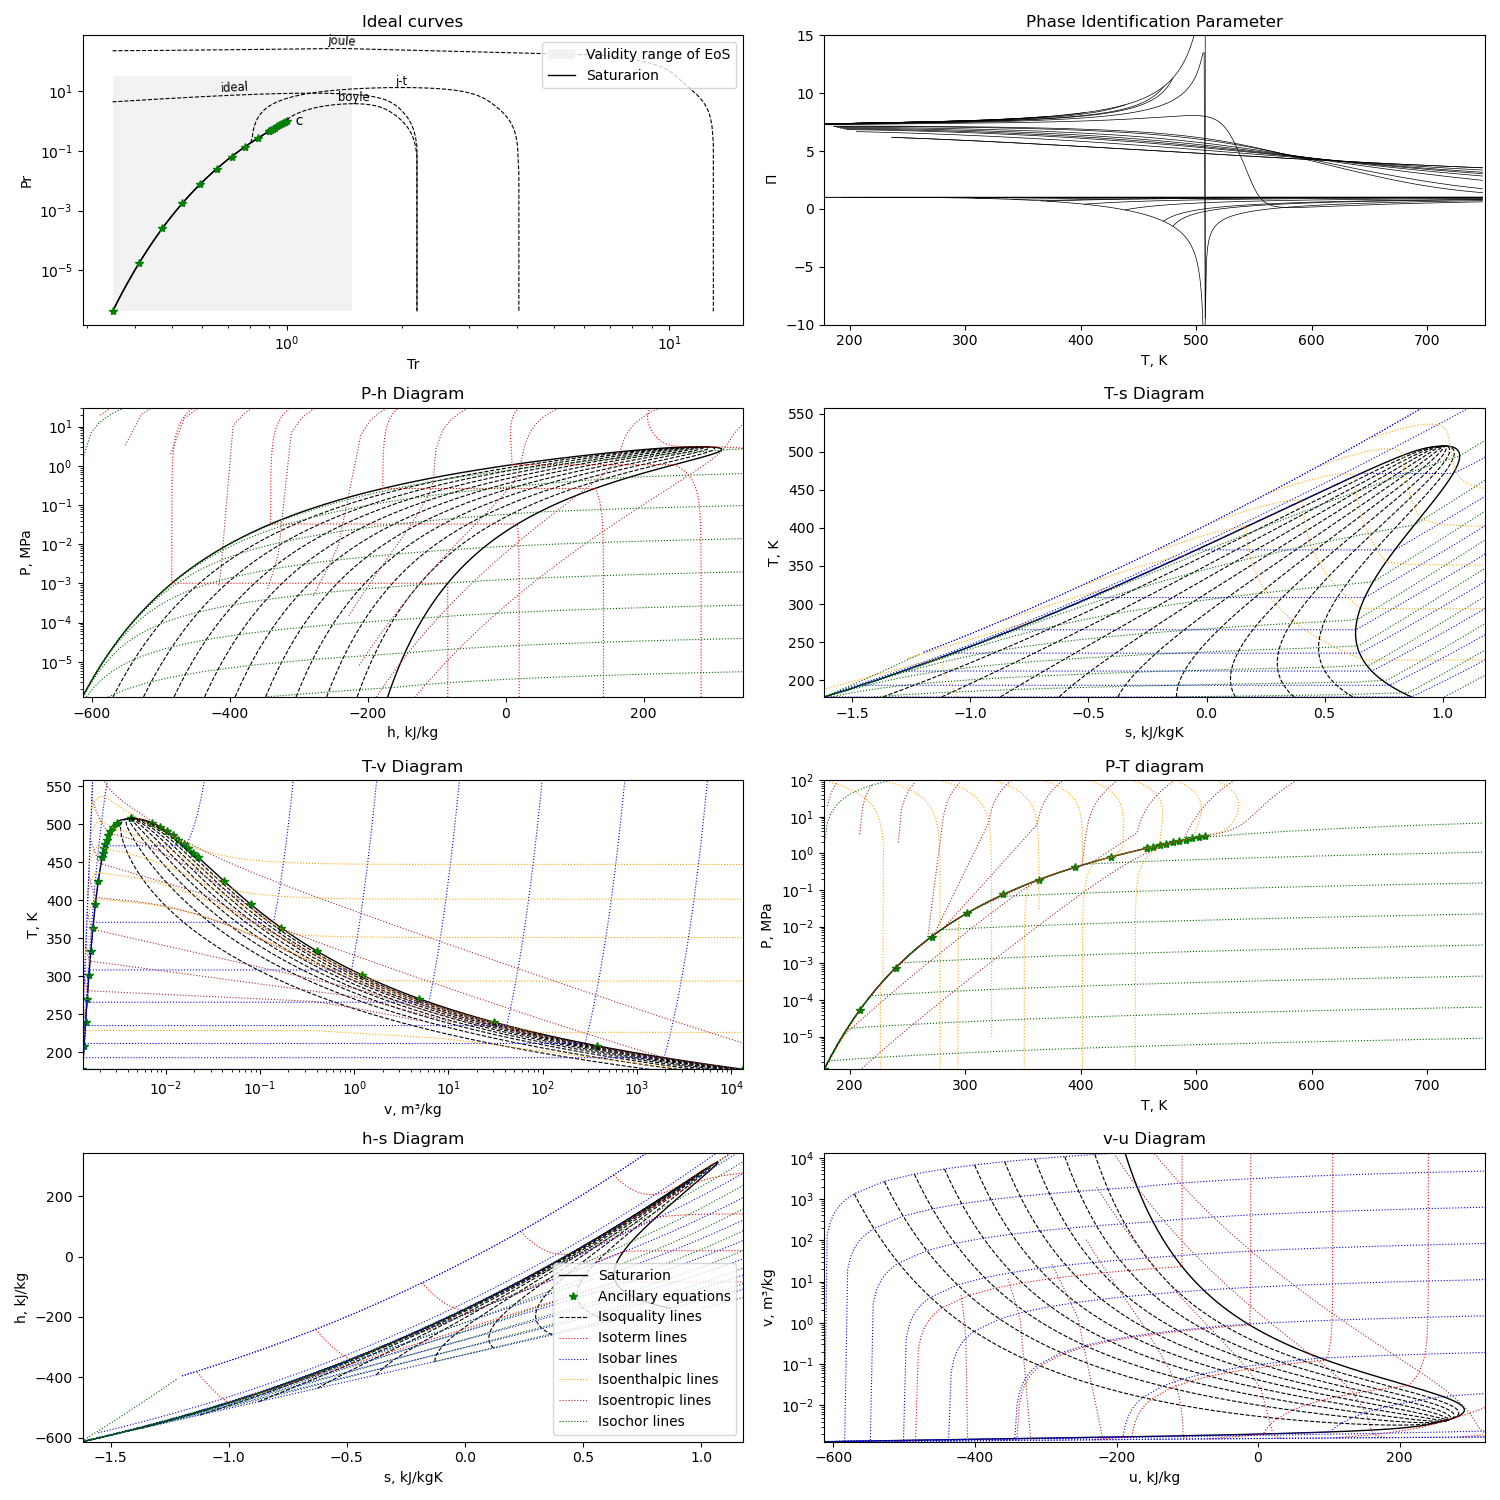
The diagram is generated with this module running with the compound name as parameter or edited in file
python3 plotMEoS.py nC6
