lib.mEoS.Ethanol
Fluid info
CAS Number: 64-17-5
Formula: C2H6O
Molecular weigth: 46.06844 g/mol
Tc: 514.7100 K
Pc: 6.2680 MPa
ρc: 273.1858 kg/m³
Tt: 159.0000 K
Tb: 351.5700 K
Acentric factor: 0.646
Dipole moment: 1.6909 Debye
Equation of state
Schroeder, J.A.; Penoncello, S.G.; Schroeder, J.S.; A Fundamental Equation of State for Ethanol. J. Phys. Chem. Ref. Data 43(4) (2014) 043102, http://dx.doi.org/10.1063/1.4895394
Estela-Uribe, J.F.; Fundamental multiparameter and association equation of state for ethanol. Fluid Phase Equilib. 452 (2017) 74-93, http://dx.doi.org/10.1016/j.fluid.2017.08.018
Dillon, H.E., Penoncello, S.G.; A Fundamental Equation for Calculation of the Thermodynamic Properties of Ethanol. Int. J. Thermophys., 25(2) (2004) 321-335, http://dx.doi.org/10.1023/B:IJOT.0000028470.49774.14
Sun, L., Ely, J.F.; Universal equation of state for engineering application: Algorithm and application to non-polar and polar fluids. Fluid Phase Equilib., 222-223 (2004) 107-118, http://dx.doi.org/10.1016/j.fluid.2004.06.028
Viscosity
Sotiriadou, S., Ntonti, E., Velliadou, D., Antoniadis, K.D., Assael, M.J., Huber, M.L.,; Reference Correlation for the Viscosity of Ethanol from the Triple Point to 620 K and Pressures up to 102 MPa. Int. J. Thermophysics 44 (2023) 40, http://dx.doi.org/10.1007/s10765-022-03149-z
Kiselev, S. B., Ely, J. F., Abdulagatov, I. M., Huber, M. L.; Generalized SAFT-DFT/DMT Model for the Thermodynamic, Interfacial, and Transport Properties of Associating Fluids: Application for n-Alkanols. Ind. Eng. Chem. Res. 44(17) (2005) 6916-6927, http://dx.doi.org/10.1021/ie050010e
Thermal Conductivity
Assael, M.J., Sykioti, E.A., Huber, M.L., Perkins, R.A.; Reference Correlation of the Thermal Conductivity of Ethanol from the Triple Point to 600 K and up to 245 MPa. J. Phys. Chem. Ref. Data 42(2) (2013) 023102, http://dx.doi.org/10.1063/1.4797368
Kiselev, S. B., Ely, J. F., Abdulagatov, I. M., Huber, M. L.; Generalized SAFT-DFT/DMT Model for the Thermodynamic, Interfacial, and Transport Properties of Associating Fluids: Application for n-Alkanols. Ind. Eng. Chem. Res. 44(17) (2005) 6916-6927, http://dx.doi.org/10.1021/ie050010e
Calculation example
Using the first option for equation of state, we can get this diagram plots with the liquid-gas saturation region:
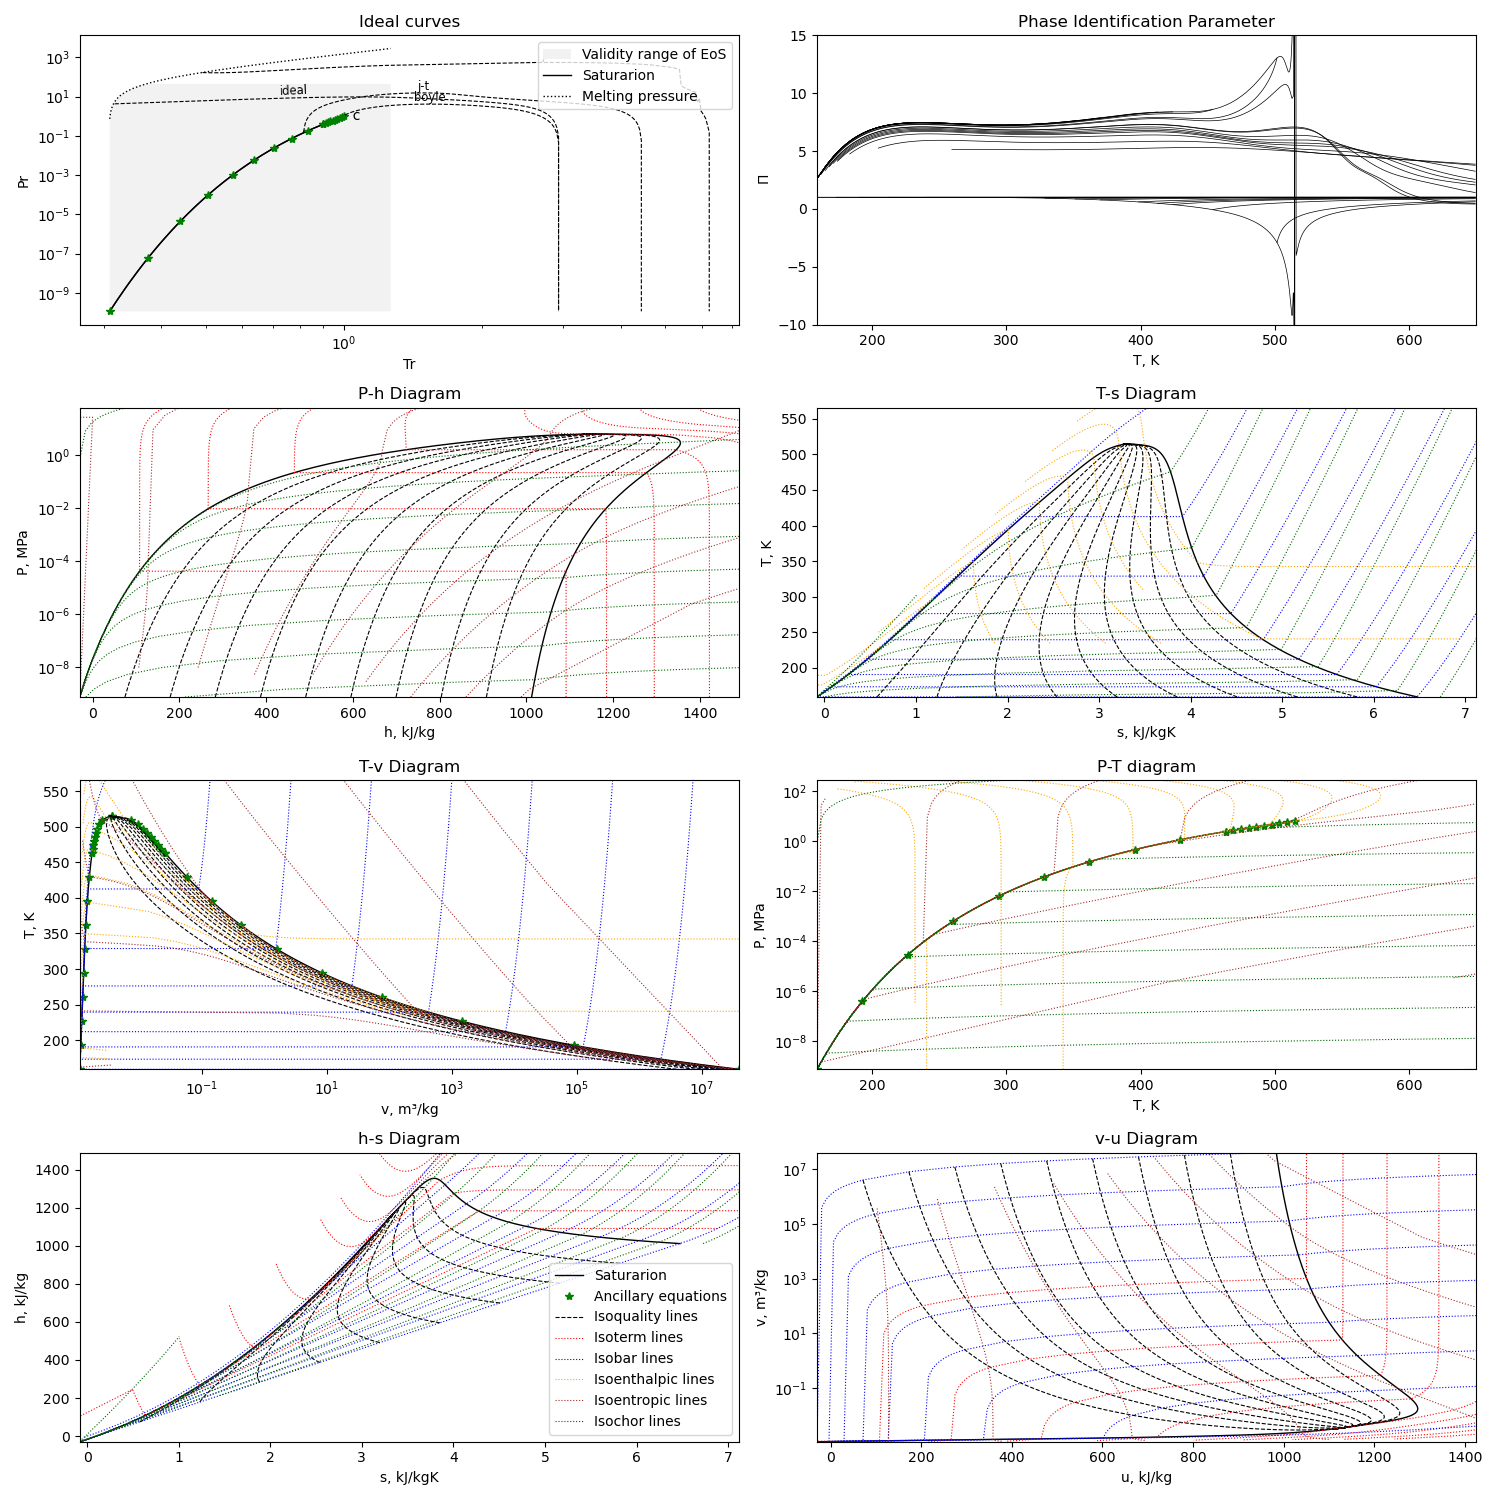
The diagram is generated with this module running with the compound name as parameter or edited in file
python3 plotMEoS.py Ethanol
