lib.mEoS.NH3
Fluid info
CAS Number: 7664-41-7
Formula: NH3
Synonym: R-717
Molecular weigth: 17.03026 g/mol
Tc: 405.4000 K
Pc: 11.3330 MPa
ρc: 225.0000 kg/m³
Tt: 195.4900 K
Tb: 239.8230 K
Acentric factor: 0.256
Dipole moment: 1.4700 Debye
Equation of state
Gao, K., Wu, J., Bell, I.H., Harvey, A.H., Lemmon E.W.; A Reference Equation of State with an Associating Term for the Thermodynamic Properties of Ammonia. J. Phys. Chem. Ref. Data 52 (2023) 013102, http://dx.doi.org/10.1063/5.0128269
Baehr, H.D., Tillner-Roth, R.; Thermodynamic Properties of Environmentally Acceptable Refrigerants: Equations of State and Tables for Ammonia, R22, R134a, R152a, and R123. Springer-Verlag, Berlin, 1994., http://dx.doi.org/10.1007/978-3-642-79400-1
Ahrendts, J., Baehr, H.D.; The Thermodynamic Properties of Ammonia. VDI-Forsch., Number 596, 1979.
Span, R., Wagner, W.; Equations of State for Technical Applications. III. Results for Polar Fluids. Int. J. Thermophys., 24(1) (2003) 111-162, http://dx.doi.org/10.1023/A:1022362231796
Sun, L., Ely, J.F.; Universal equation of state for engineering application: Algorithm and application to non-polar and polar fluids. Fluid Phase Equilib., 222-223 (2004) 107-118, http://dx.doi.org/10.1016/j.fluid.2004.06.028
Viscosity
Monogenidou, S.A., Assael, M.J., Huber, M.L.; Reference Correlation for the Viscosity of Ammonia from the Triple Point to 725K and up to 50 MPa. J. Phys. Chem. Ref. Data 47(2) (2018) 023102, http://dx.doi.org/10.1063/1.5036724
Fenghour, A., Wakeham, W.A., Vesovic, V., Watson, J.T.R., Millat, J., Vogel, E.; The Viscosity of Ammonia. J. Phys. Chem. Ref. Data 24(5) (1995) 1649-1667, http://dx.doi.org/10.1063/1.555961
Thermal Conductivity
Monogenidou, S.A., Assael, M.J., Huber, M.L.; Reference Correlations for the Thermal Conductivity of Ammonia from the Triple Point to 680 K and Pressures up to 80 MPa. J. Phys. Chem. Ref. Data 47(4) (2018) 043101, http://dx.doi.org/10.1063/1.5053087
Tufeu, R., Ivanov, D.Y., Garrabos, Y., Le Neindre, B.; Thermal Conductivity of Ammonia in a Large Temperature and Pressure Range Including the Critical Region. Ber. Bunsenges. Phys. Chem. 88 (1984) 422-427, http://dx.doi.org/10.1002/bbpc.19840880421
Calculation example
Using the first option for equation of state, we can get this diagram plots with the liquid-gas saturation region:
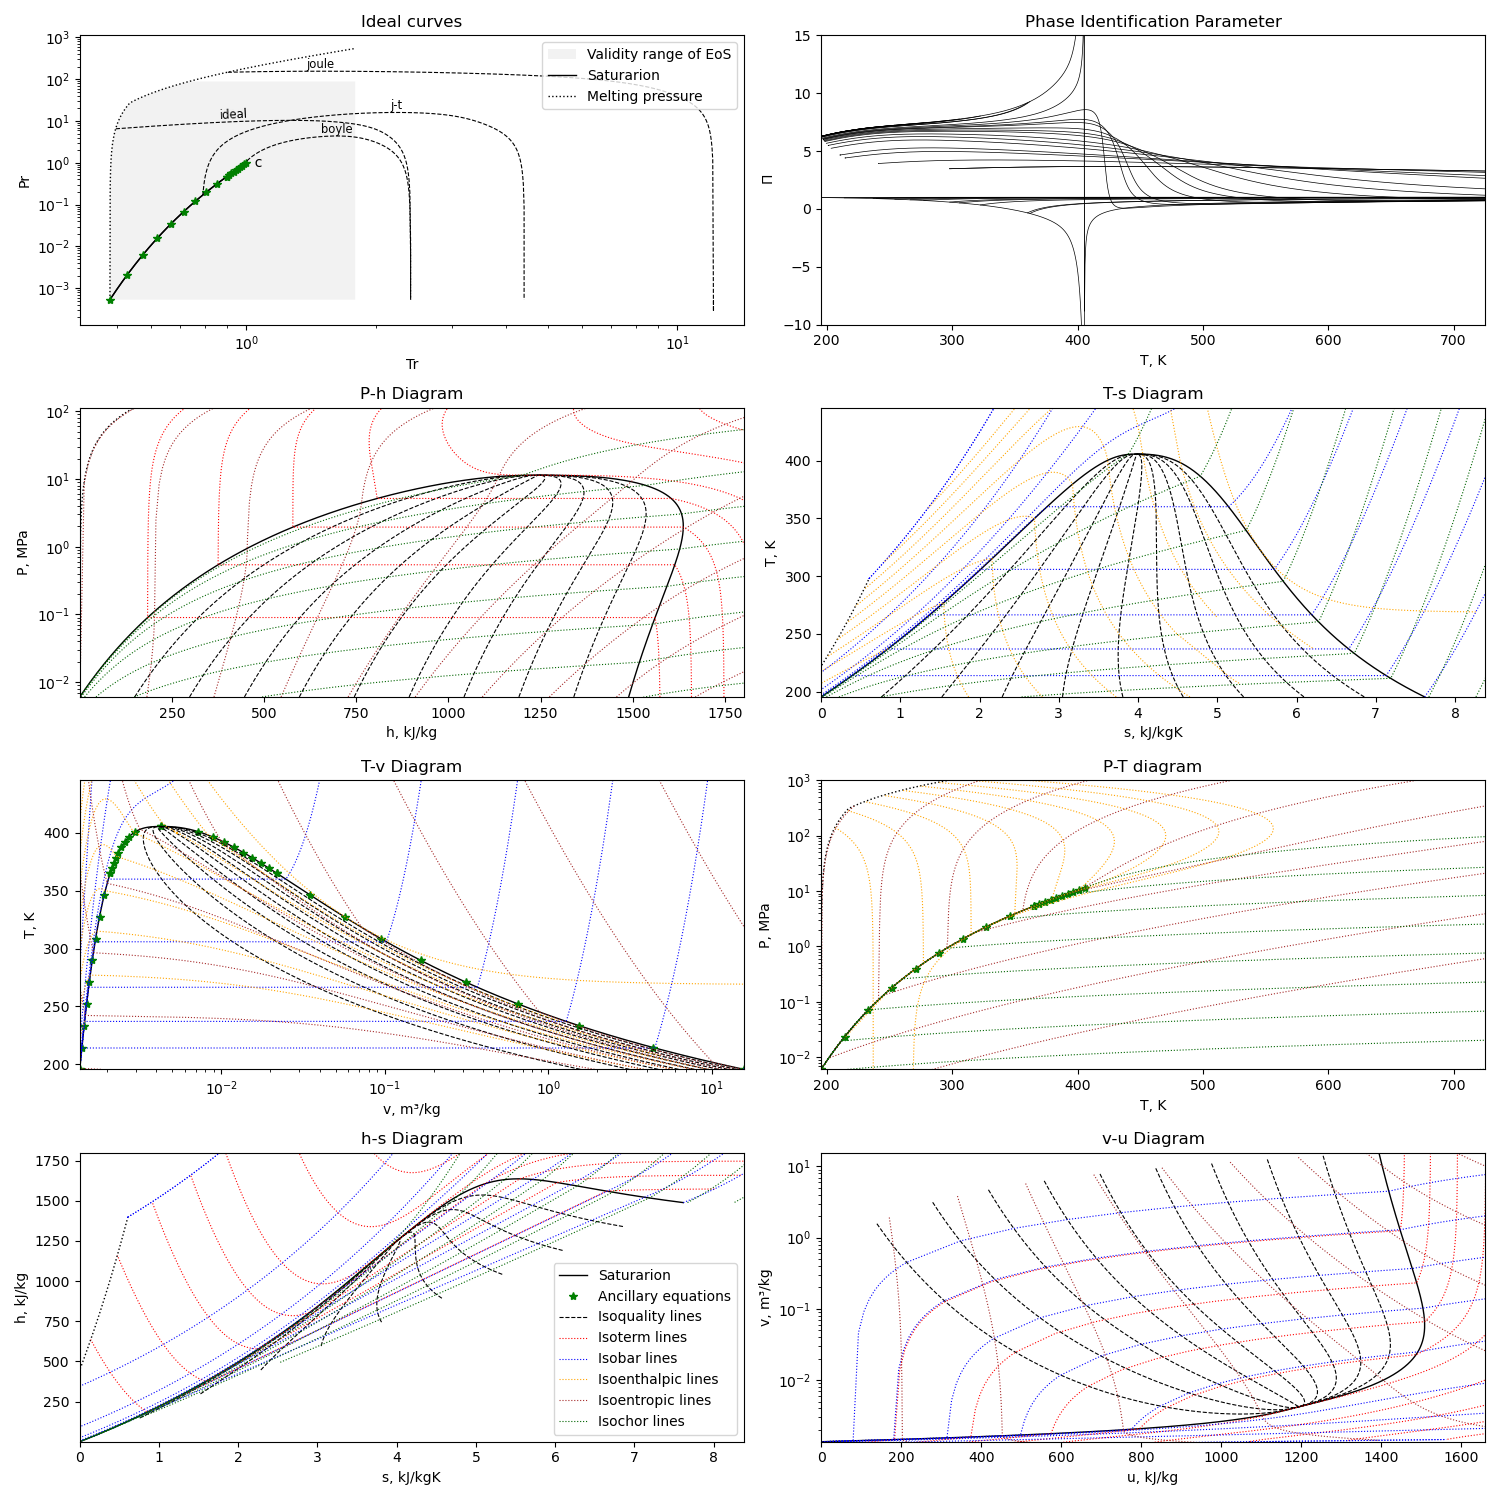
The diagram is generated with this module running with the compound name as parameter or edited in file
python3 plotMEoS.py NH3
