tools.UI_psychrometry module
This tool show a psychrometry (humid air) chart.

The chart let user click to get the properties. Furthermore it’s possible define a point using the lateral panel and any of the input pair availables:
Dry bulb temperature - Humidity Ratio
Dry bulb temperature - Relative humidity
Dry bulb temperature - Wet bulb temperature
Dry bulb temperature - Dew point temperature
Dew point temperature - Relative humidity
Wet bulb temperature - Relative humidity
Also it’s possible change the pressure of the chart, or the altitude using the standard ASHRAE atmosphere equation
The chart can be saved as image file using the apropiate button.
Configuration
The chart can be configurated using the dialog
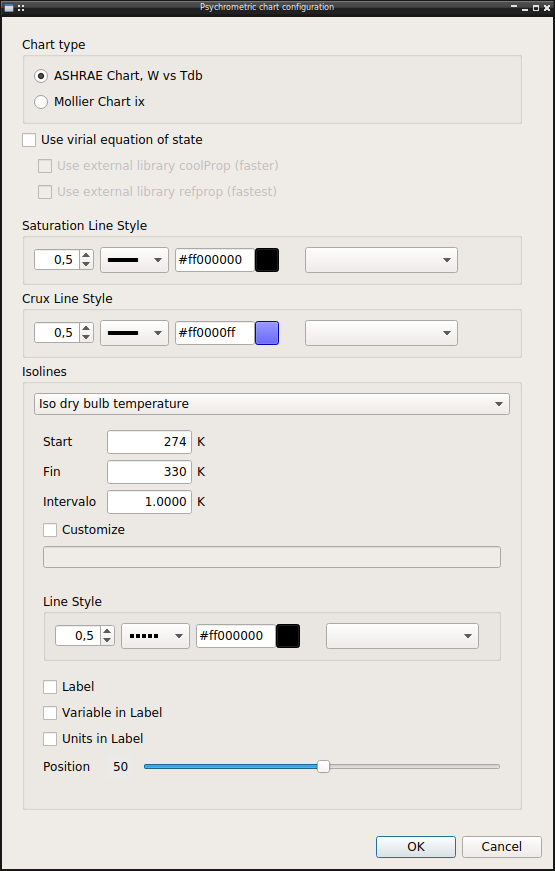
Chart type
There is two kind of psychrometric chart used in engineering, both supported, the normal ASHRAE chart with humidity ratio vs dry bulb temperature and the Mollier Chart with inverted axes.
Equation to use
By default use the ideal equation of state. The other option using the virial equation of state are unimplemented, only the external CoolProp library is now working
Line Style
For each kind of line it’s possible configure the line style, width, linestyle, color, marker …
Units
The units used in chart are the used in the last project open in main program. So it’s configurable using the project units configuration dialog.
API reference
- The module include all related psychrometry chart functionality
UI_Psychrometry: Psychrometric chartPsychroPlot: Plot widget for psychrometric chartPsychroInput: Widget with input for psychrometric state
and its configuration
Config: Psychrometric chart configuration
ConfigDialog: Dialog tool for standalone use
- tools.UI_psychrometry.translate(context: str, sourceText: str, disambiguation: str = None, n: int = -1) str
- class tools.UI_psychrometry.PsychroPlot(*args, **kwargs)[source]
Bases:
PlotWidget- Plot widget for psychrometric chart
Add custom margins Define a point for text state properties, to easy remove and redraw
Methods
Clear crux lines for click interaction in plot
Delete point data from plot
config(config)Apply configuration to plot
createCrux(state, chart)Update horizontal and vertical lines to show click point
showPointData(state[, chart])Update data of current cursor point in plot annotates
- class tools.UI_psychrometry.PsychroInput(state=None, readOnly=False, parent=None)[source]
Bases:
QWidgetWidget with parameter for psychrometric state
Methods
changeAltitude(value)Change pressure through altitude and ICAO equation
changePressure(value)Change pressure to global plot and for states
setReadOnly(readOnly)Set readOnly all widget
setState(state)Fill data input with state properties
updateInputs(index)Update inputs appearance to highlight active
updateKwargs(key, value)Update kwargs of state instance, if its correctly defined show it
pressureChanged
stateChanged
- parameters = ['tdb', 'twb', 'tdp', 'w', 'HR', 'v', 'h']
- stateChanged
pyqtSignal(*types, name: str = …, revision: int = …, arguments: Sequence = …) -> PYQT_SIGNAL
types is normally a sequence of individual types. Each type is either a type object or a string that is the name of a C++ type. Alternatively each type could itself be a sequence of types each describing a different overloaded signal. name is the optional C++ name of the signal. If it is not specified then the name of the class attribute that is bound to the signal is used. revision is the optional revision of the signal that is exported to QML. If it is not specified then 0 is used. arguments is the optional sequence of the names of the signal’s arguments.
- pressureChanged
pyqtSignal(*types, name: str = …, revision: int = …, arguments: Sequence = …) -> PYQT_SIGNAL
types is normally a sequence of individual types. Each type is either a type object or a string that is the name of a C++ type. Alternatively each type could itself be a sequence of types each describing a different overloaded signal. name is the optional C++ name of the signal. If it is not specified then the name of the class attribute that is bound to the signal is used. revision is the optional revision of the signal that is exported to QML. If it is not specified then 0 is used. arguments is the optional sequence of the names of the signal’s arguments.
- class tools.UI_psychrometry.UI_Psychrometry(parent=None)[source]
Bases:
QDialogPsychrometric charts tool
Methods
click(event)Update input and graph annotate when mouse click over chart
Show configuration dialog
createState(x, y)Create psychrometric state from click or mouse position
drawlabel(name, t, W, label, unit)Draw annotation for isolines
plot()Plot chart
setProgressValue(value)Update progress bar with new value
showToolBar(checked)Show/Hide left toolbar with additional funcionality
- class tools.UI_psychrometry.Config(config, parent=None)[source]
Bases:
QWidgetPhychrometric chart configuration
Methods
value(config)Return value for main dialog
- lineas = [('IsoTdb', <class 'lib.unidades.Temperature'>, 'Iso dry bulb temperature'), ('IsoW', <class 'float'>, 'Iso absolute humidity'), ('IsoHR', <class 'float'>, 'Iso relative humidity'), ('IsoTwb', <class 'lib.unidades.Temperature'>, 'Iso wet bulb temperature'), ('Isochor', <class 'lib.unidades.SpecificVolume'>, 'Isochor')]
