plots.standing module
Plot the Standing-Katz diagram that relates compresibility factor with the reduced temperature and pression of a gas state.

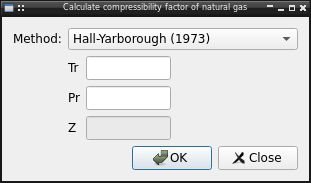
The diagram is configured in extended format for better visibility of all zones. Support for click interaction, let user save the chart as image and a dialog to calculate the compresibility factor:
Configuration
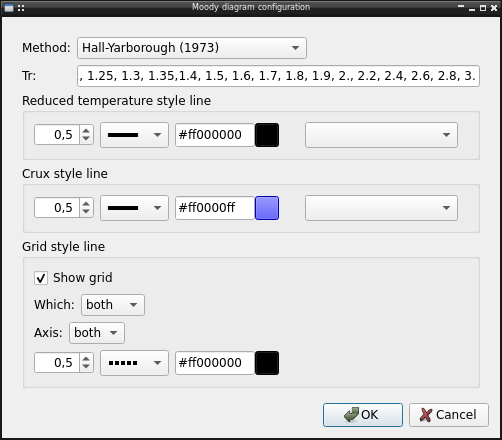
The diagram let user configure several options like:
Equation to use, by default the Hall-Yarborough correlation, but it’s possible use one of available in lib.crude
Reduced temperatures lines plotted in diagram
Line style used in plot
Line style used in crux when use mouse
Grid line visibility and style
API Reference
- The module include all related moody chart functionality
Standing_Katz: Chart dialogcalculate(): Calculate procedureCalculateDialog: Dialog to calculate a specified point and its configurationConfig: Standing-Katz chart configuration
- plots.standing.translate(context: str, sourceText: str, disambiguation: str = None, n: int = -1) str
- plots.standing.calculate(config, dat=None)[source]
Plot calculate procedure
- Parameters:
- configConfigparser
pychemqt configparser configuration instance
- datdict
dict with other method data
- Returns:
- datdict
dict with method data
Notes
This procedure is called when a new method of calculation of Z is necessary. Add the new data to the input dat with the other Method calculated yet
- class plots.standing.Config(config=None, parent=None)[source]
Bases:
QWidgetStanding-Katz chart configuration
Methods
value(config)Update ConfigParser instance with the config
- TITLE = 'Standing-Katz chart'
- TITLECONFIG = 'Standing-Katz chart configuration'
- class plots.standing.Standing_Katz(parent=None)[source]
Bases:
ChartStanding-Katz chart dialog
- Attributes:
- note
Methods
Define the functionality when click the calculate point button
Delete crux and note text
click(event)Update input and graph annotate when mouse click over chart
createCrux(Tr, Pr, Z)Create a crux in selected point of plot and show data at bottom right corner
customUI()Define custom UI element
paintEvent(event)Do redraw in each change of window size or position
plot()Plot the Standing-Katz chart using the indicate method
savePNG()Save chart image to png file
setMask()Mask both plot to show only the region useful
- title = 'Standing and Katz compressivitity factors chart for natural gas'
- locLogo = (0.8, 0.12, 0.1, 0.1)
- note = None
